List of countries by cherry production
This is a list of countries by cherry production from the years 2016 to 2018, based on data from the Food and Agriculture Organization Corporate Statistical Database.[1][n 1] The estimated total world production for 2018 was 4,076,944 metric tonnes, increasing by 12.9% from 3,611,283 tonnes in 2017.[n 2]
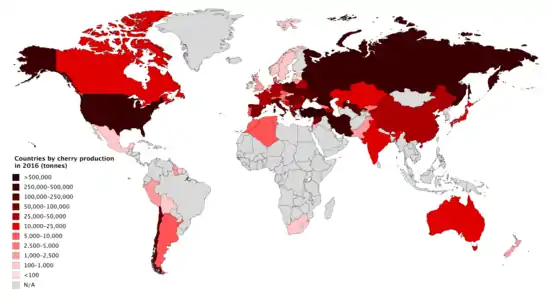
Countries by cherry production in 2016
Production by country
| Rank | Country | 2018 | 2017 | 2016 |
|---|---|---|---|---|
| 1 | 823,731 | 809,006 | 792,150 | |
| 2 | 447,740 | 514,086 | 460,878 | |
| 3 | 303,340 | 243,130 | 219,770 | |
| 4 | 278,600 | 223,800 | 264,000 | |
| 5 | 260,589 | 91,264 | 248,590 | |
| 6 | 246,975 | 248,986 | 244,847 | |
| 7 | 228,700 | 193,678 | 164,042 | |
| 8 | 156,070 | 129,635 | 126,315 | |
| 9 | 147,176 | 118,982 | 117,466 | |
| 10 | 122,396 | 125,845 | 102,462 | |
| 11 | 107,000 | 114,803 | 100,933 | |
| 12 | 94,791 | 80,308 | 84,251 | |
| 13 | 91,200 | 82,041 | 84,944 | |
| 14 | 90,837 | 58,474 | 73,834 | |
| 15 | 60,125 | 24,803 | 45,342 | |
| 16 | 60,100 | 52,497 | 42,042 | |
| 17 | 54,200 | 54,200 | 54,200 | |
| 18 | 49,915 | 46,371 | 44,692 | |
| 19 | 41,490 | 10,716 | 41,070 | |
| 20 | 37,577 | 38,980 | 37,487 | |
| 21 | 37,576 | 37,223 | 37,191 | |
| 22 | 33,904 | 31,893 | 25,167 | |
| 23 | 31,380 | 40,464 | 34,685 | |
| 24 | 20,119 | 15,635 | 11,719 | |
| 25 | 18,777 | 19,193 | 18,003 | |
| 26 | 18,100 | 19,100 | 19,800 | |
| 27 | 17,822 | 12,531 | 14,926 | |
| 28 | 17,650 | 19,752 | 17,550 | |
| 29 | 17,254 | 12,541 | 15,877 | |
| 30 | 16,362 | 8,469 | 13,646 | |
| 31 | 15,964 | 11,532 | 18,374 | |
| 32 | 13,665 | 13,406 | 8,093 | |
| 33 | 11,991 | 6,125 | 3,959 | |
| 34 | 10,950 | 10,852 | 10,781 | |
| 35 | 9,661 | 10,206 | 9,309 | |
| 36 | 9,528 | 6,201 | 9,213 | |
| 37 | 8,818 | 9,193 | 6,903 | |
| 38 | 7,285 | 7,246 | 7,207 | |
| 39 | 6,113 | 6,000 | 5,685 | |
| 40 | 5,712 | 5,583 | 5,618 | |
| 41 | 5,500 | 4,300 | 5,647 | |
| 42 | 5,043 | 5,447 | 4,633 | |
| 43 | 4,400 | 2,100 | 3,700 | |
| 44 | 3,845 | 4,193 | 3,650 | |
| 45 | 3,568 | 6,484 | 1,700 | |
| 46 | 3,000 | 4,000 | 3,500 | |
| 47 | 2,359 | 2,701 | 2,210 | |
| 48 | 2,302 | 2,620 | 2,378 | |
| 49 | 2,077 | 2,069 | 2,066 | |
| 50 | 1,964 | 2,067 | 2,140 | |
| 51 | 1,364 | 1,304 | 1,229 | |
| 52 | 1,280 | 1,265 | 4,118 | |
| 53 | 1,256 | 916 | 902 | |
| 54 | 1,212 | 1,188 | 1,163 | |
| 55 | 1,017 | 623 | 686 | |
| 56 | 950 | 942 | 925 | |
| 57 | 936 | 916 | 632 | |
| 58 | 753 | 943 | 940 | |
| 59 | 678 | 661 | 1,374 | |
| 60 | 671 | 519 | 974 | |
| 61 | 410 | 245 | 425 | |
| 62 | 380 | 391 | 399 | |
| 63 | 328 | 337 | 341 | |
| 64 | 178 | 72 | 207 | |
| 65 | 119 | 79 | 111 | |
| 66 | 90 | 100 | 100 | |
| 67 | 73 | 53 | 84 | |
| 68 | 10 | 0 | 11 | |
Notes
- Includes both sweet and sour cherries.
- Sum of values for countries with available data, which may be official or FAO data based on imputation methodology
References
- "Crops". FAOSTAT. Retrieved 18 December 2020. Countries - Select All; Regions - World + (Total); Elements - Production Quantity; Items - Cherries + Cherries, sour; Years - 2018 + 2017 + 2016
This article is issued from Wikipedia. The text is licensed under Creative Commons - Attribution - Sharealike. Additional terms may apply for the media files.