List of countries by coconut production
This is a list of countries by coconut production from the years 2016 to 2018, based on data from the Food and Agriculture Organization Corporate Statistical Database.[1] The estimated total world production for coconuts in 2018 was 61,865,423 metric tonnes, up 2.4% from 60,444,228 tonnes in 2017.[n 1] Dependent territories are shown in italics.
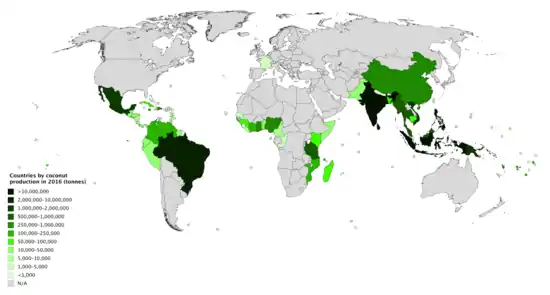
Countries by coconut production in 2016
Production by country
| Rank | Country/Region | 2018 | 2017 | 2016 |
|---|---|---|---|---|
| 1 | 18,555,371 | 18,747,003 | 17,979,533 | |
| 2 | 14,726,165 | 14,049,131 | 13,825,080 | |
| 3 | 11,706,343 | 11,166,772 | 11,344,306 | |
| 4 | 2,623,000 | 2,445,000 | 3,011,000 | |
| 5 | 2,346,750 | 2,210,139 | 2,634,396 | |
| 6 | 1,571,709 | 1,499,228 | 1,469,960 | |
| 7 | 1,221,080 | 1,203,796 | 1,186,513 | |
| 8 | 1,158,471 | 1,157,614 | 1,156,757 | |
| 9 | 885,751 | 895,000 | 900,000 | |
| 10 | 557,240 | 545,994 | 531,653 | |
| 11 | 546,301 | 544,879 | 543,107 | |
| 12 | 519,153 | 517,589 | 504,773 | |
| 13 | 466,975 | 408,635 | 374,269 | |
| 14 | 403,492 | 390,939 | 374,474 | |
| 15 | 394,883 | 383,382 | 380,380 | |
| 16 | 386,258 | 385,140 | 384,518 | |
| 17 | 383,123 | 372,565 | 371,250 | |
| 18 | 374,628 | 476,201 | 559,000 | |
| 19 | 285,200 | 281,626 | 283,140 | |
| 20 | 249,900 | 251,484 | 253,068 | |
| 21 | 227,223 | 234,183 | 241,045 | |
| 22 | 180,933 | 177,932 | 173,550 | |
| 23 | 174,135 | 169,544 | 167,400 | |
| 24 | 156,501 | 151,584 | 157,391 | |
| 25 | 148,096 | 145,330 | 142,564 | |
| 26 | 136,603 | 136,606 | 170,699 | |
| 27 | 136,176 | 138,634 | 141,092 | |
| 28 | 126,633 | 128,584 | 135,908 | |
| 29 | 119,505 | 119,505 | 65,329 | |
| 30 | 106,137 | 104,410 | 102,682 | |
| 31 | 92,560 | 92,313 | 115,228 | |
| 32 | 83,784 | 83,803 | 83,552 | |
| 33 | 73,001 | 73,737 | 74,474 | |
| 34 | 69,365 | 69,088 | 69,534 | |
| 35 | 57,658 | 56,214 | 54,771 | |
| 36 | 57,310 | 58,552 | 59,815 | |
| 37 | 45,108 | 48,875 | 48,000 | |
| 38 | 39,227 | 39,709 | 40,192 | |
| 39 | 32,934 | 36,533 | 30,400 | |
| 40 | 32,923 | 32,645 | 32,353 | |
| 41 | 27,546 | 27,033 | 27,000 | |
| 42 | 24,342 | 30,442 | 30,400 | |
| 43 | 22,700 | 22,663 | 23,856 | |
| 44 | 19,561 | 20,348 | 19,633 | |
| 45 | 19,394 | 19,208 | 19,006 | |
| 46 | 19,245 | 20,000 | 20,000 | |
| 47 | 18,639 | 18,747 | 18,855 | |
| 48 | 17,895 | 18,014 | 17,657 | |
| 49 | 15,895 | 15,733 | 15,494 | |
| 50 | 15,485 | 15,000 | 14,515 | |
| 51 | 14,574 | 14,072 | 14,672 | |
| 52 | 13,760 | 14,026 | 16,000 | |
| 53 | 13,573 | 13,622 | 13,671 | |
| 54 | 13,572 | 13,844 | 14,116 | |
| 55 | 12,443 | 12,418 | 13,000 | |
| 56 | 11,074 | 11,063 | 11,137 | |
| 57 | 9,731 | 9,765 | 9,867 | |
| 58 | 9,134 | 9,133 | 9,131 | |
| 59 | 7,669 | 7,584 | 7,498 | |
| 60 | 7,442 | 7,563 | 8,000 | |
| 61 | 7,336 | 7,242 | 7,147 | |
| 62 | 6,531 | 6,469 | 6,407 | |
| 63 | 6,524 | 6,553 | 6,596 | |
| 64 | 5,993 | 5,993 | 6,000 | |
| 65 | 5,480 | 5,505 | 5,530 | |
| 66 | 5,098 | 5,095 | 5,092 | |
| 67 | 4,722 | 4,897 | 4,726 | |
| 68 | 4,629 | 4,563 | 4,502 | |
| 69 | 4,082 | 4,442 | 4,577 | |
| 70 | 3,867 | 3,753 | 3,638 | |
| 71 | 3,860 | 3,915 | 3,993 | |
| 72 | 3,412 | 3,417 | 3,422 | |
| 73 | 3,113 | 3,012 | 3,000 | |
| 74 | 3,081 | 2,981 | 2,881 | |
| 75 | 2,846 | 2,870 | 2,754 | |
| 76 | 2,650 | 2,639 | 2,658 | |
| 77 | 2,618 | 2,455 | 2,405 | |
| 78 | 2,579 | 2,518 | 2,500 | |
| 79 | 2,419 | 2,457 | 2,495 | |
| 80 | 2,407 | 2,560 | 3,200 | |
| 81 | 2,104 | 1,824 | 1,634 | |
| 82 | 1,670 | 1,710 | 1,750 | |
| 83 | 1,629 | 1,633 | 1,622 | |
| 84 | 1,489 | 1,494 | 1,481 | |
| 85 | 1,138 | 1,138 | 1,139 | |
| 86 | 740 | 799 | 786 | |
| 87 | 454 | 306 | 334 | |
| 88 | 417 | 348 | 683 | |
| 89 | 400 | 396 | 391 | |
| 90 | 233 | 234 | 235 | |
| 91 | 225 | 435 | 1,157 | |
| 92 | 220 | 220 | 220 | |
| 93 | 102 | 103 | 103 | |
| 94 | 55 | 54 | 53 | |
| 95 | 19 | 19 | 18 | |
Notes
- Sum of values for countries with available data, which may be official or FAO data based on imputation methodology
References
- "Crops". FAOSTAT. Retrieved 18 December 2020. Countries - Select All; Regions - World + (Total); Elements - Production Quantity; Items - Coconuts; Years - 2018 + 2017 + 2016
This article is issued from Wikipedia. The text is licensed under Creative Commons - Attribution - Sharealike. Additional terms may apply for the media files.