List of countries by papaya production
This is a list of countries by papaya production from the years 2016 to 2018, based on data from the Food and Agriculture Organization Corporate Statistical Database.[1] The estimated total world production for papayas in 2018 was 13,290,320 metric tonnes, up by 2.5% from 12,971,418 tonnes in 2017.[n 1] India was by far the largest producer, accounting for 45% of global production. Dependent territories are shown in italics.
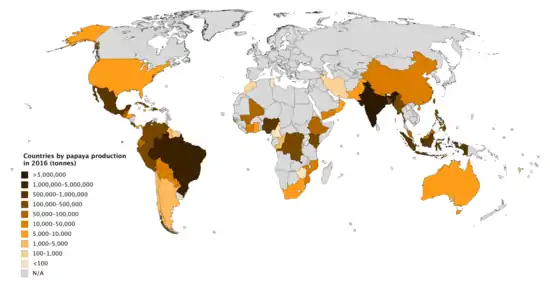
Countries by papaya production in 2016
Production by country
>100,000 tonnes
| Rank | Country/Region | 2018 | 2017 | 2016 |
|---|---|---|---|---|
| 1 | 5,989,000 | 5,940,000 | 5,667,000 | |
| 2 | 1,060,392 | 1,058,487 | 1,296,940 | |
| 3 | 1,039,820 | 961,768 | 951,922 | |
| 4 | 1,022,498 | 869,306 | 863,201 | |
| 5 | 887,591 | 875,112 | 904,284 | |
| 6 | 833,038 | 829,563 | 827,482 | |
| 7 | 213,769 | 214,405 | 215,040 | |
| 8 | 188,636 | 178,164 | 175,677 | |
| 9 | 183,732 | 179,899 | 177,458 | |
| 10 | 176,630 | 189,086 | 212,579 | |
| 11 | 176,043 | 178,280 | 173,269 | |
| 12 | 175,988 | 177,171 | 169,437 | |
| 13 | 169,143 | 167,043 | 162,481 | |
| 14 | 131,598 | 134,647 | 130,371 | |
| 15 | 131,456 | 129,089 | 127,423 | |
| 16 | 127,244 | 125,521 | 105,921 | |
1,000–100,000 tonnes
| Rank | Country/Region | 2018 | 2017 | 2016 |
|---|---|---|---|---|
| 17 | 93,278 | 84,033 | 96,896 | |
| 18 | 85,500 | 54,000 | 100,000 | |
| 19 | 67,319 | 61,673 | 54,664 | |
| 20 | 62,896 | 59,670 | 56,091 | |
| 21 | 50,519 | 83,797 | 65,967 | |
| 22 | 49,628 | 49,282 | 50,818 | |
| 23 | 45,857 | 48,909 | 50,396 | |
| 24 | 42,760 | 42,696 | 42,631 | |
| 25 | 40,422 | 39,181 | 37,939 | |
| 26 | 27,365 | 25,295 | 28,989 | |
| 27 | 21,723 | 21,735 | 21,591 | |
| 28 | 18,040 | 17,339 | 18,216 | |
| 29 | 16,082 | 19,770 | 17,910 | |
| 30 | 14,505 | 12,912 | 14,137 | |
| 31 | 14,091 | 13,909 | 13,664 | |
| 32 | 13,296 | 5,462 | 4,256 | |
| 33 | 12,909 | 13,739 | 15,525 | |
| 34 | 11,267 | 11,265 | 11,286 | |
| 35 | 9,751 | 9,919 | 9,641 | |
| 36 | 9,537 | 7,705 | 8,582 | |
| 37 | 7,878 | 7,835 | 7,726 | |
| 38 | 7,781 | 7,111 | 8,151 | |
| 39 | 7,201 | 6,548 | 6,185 | |
| 40 | 6,402 | 6,385 | 6,293 | |
| 41 | 6,274 | 5,763 | 5,561 | |
| 42 | 5,572 | 5,772 | 5,772 | |
| 43 | 4,717 | 12,800 | 8,963 | |
| 44 | 3,982 | 3,900 | 3,819 | |
| 45 | 3,414 | 3,430 | 3,445 | |
| 46 | 3,408 | 1,662 | 2,920 | |
| 47 | 3,285 | 3,434 | 3,174 | |
| 48 | 3,186 | 3,301 | 3,185 | |
| 49 | 2,296 | 2,567 | 2,723 | |
| 50 | 2,182 | 2,179 | 2,176 | |
| 51 | 1,833 | 1,252 | 917 | |
| 52 | 1,792 | 1,957 | 1,565 | |
| 53 | 1,312 | 1,270 | 942 | |
<1,000 tonnes
| Rank | Country/Region | 2018 | 2017 | 2016 |
|---|---|---|---|---|
| 54 | 810 | 745 | 713 | |
| 55 | 780 | 762 | 744 | |
| 56 | 691 | 682 | 673 | |
| 57 | 587 | 595 | 601 | |
| 58 | 556 | 554 | 553 | |
| 59 | 316 | 318 | 530 | |
| 60 | 172 | 171 | 171 | |
| 61 | 143 | 152 | 247 | |
| 62 | 101 | 101 | 101 | |
| 63 | 83 | 83 | 83 | |
| 64 | 73 | 73 | 72 | |
| 65 | 47 | 46 | 45 | |
| 66 | 44 | 43 | 42 | |
| 66 | 44 | 60 | 61 | |
| 68 | 36 | 36 | 37 | |
Notes
- Sum of values for countries with available data, which may be official or FAO data based on imputation methodology
References
- "Crops". FAOSTAT. Retrieved 18 December 2019. Countries - Select All; Regions - World + (Total); Elements - Production Quantity; Items - Papayas; Years - 2018 + 2017 + 2016
This article is issued from Wikipedia. The text is licensed under Creative Commons - Attribution - Sharealike. Additional terms may apply for the media files.