1888 United States presidential election in New Hampshire
The 1888 United States presidential election in New Hampshire took place on November 6, 1888, as part of the 1888 United States presidential election. Voters chose four representatives, or electors to the Electoral College, who voted for president and vice president.
| ||||||||||||||||||||||||||
| ||||||||||||||||||||||||||
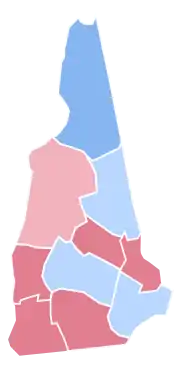 County Results
| ||||||||||||||||||||||||||
| ||||||||||||||||||||||||||
| Elections in New Hampshire |
|---|
 |
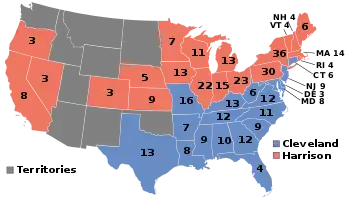
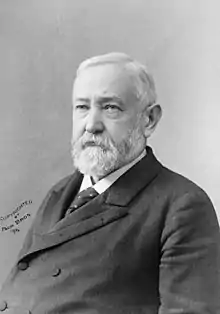
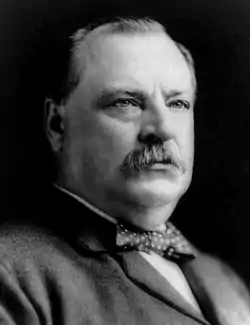
New Hampshire voted for the Republican nominee, Benjamin Harrison, over the Democratic nominee, incumbent President Grover Cleveland. Harrison won the state by a narrow margin of 2.50%.
This would be the last election when bellwether Coös County in the far north voted for a losing presidential candidate until voting for Hubert Humphrey over Richard Nixon in 1968. It would also be the last election when a Democratic presidential candidate carried Merrimack and Rockingham Counties until 1912, when the Republican Party was divided between Progressive Theodore Roosevelt and conservative incumbent Taft, and the last when those went Democratic in a two-way contest until Lyndon Johnson in 1964.[1]
Results
| 1888 United States presidential election in New Hampshire[2] | ||||||||
|---|---|---|---|---|---|---|---|---|
| Party | Candidate | Running mate | Popular vote | Electoral vote | ||||
| Count | % | Count | % | |||||
| Republican | Benjamin Harrison of Indiana | Levi Parsons Morton of New York | 45,728 | 50.34% | 4 | 100.00% | ||
| Democratic | Grover Cleveland of New York | Allen Granberry Thurman of Ohio | 43,456 | 47.84% | 0 | 0.00% | ||
| Prohibition | Clinton Bowen Fisk of New Jersey | John Anderson Brooks of Missouri | 1,593 | 1.75% | 0 | 0.00% | ||
| N/A | Others | Others | 58 | 0.06% | 0 | 0.00% | ||
| Total | 90,835 | 100.00% | 4 | 100.00% | ||||
Results by county
| Benjamin Harrison[3] Republican |
Stephen Grover Cleveland[3] Democratic |
Clinton Bowen Fisk[4] Prohibition |
Various candidates[4] Other parties |
Margin | Total votes cast[lower-alpha 1] | ||||||
|---|---|---|---|---|---|---|---|---|---|---|---|
| County | # | % | # | % | # | % | # | % | # | % | # |
| Belknap | 2,687 | 50.32% | 2,540 | 47.57% | 113 | 2.12% | 147 | 2.75% | 5,340 | ||
| Carroll | 2,338 | 47.39% | 2,434 | 49.33% | 162 | 3.28% | -96 | -1.95% | 4,934 | ||
| Cheshire | 4,118 | 55.70% | 3,165 | 42.81% | 110 | 1.49% | 953 | 12.89% | 7,393 | ||
| Coös | 2,298 | 45.18% | 2,744 | 53.95% | 44 | 0.87% | -446 | -8.77% | 5,086 | ||
| Grafton | 5,210 | 49.73% | 5,075 | 48.44% | 191 | 1.82% | 135 | 1.29% | 10,476 | ||
| Hillsborough | 9,460 | 52.07% | 8,440 | 46.46% | 268 | 1.48% | 1,020 | 5.61% | 18,168 | ||
| Merrimack | 6,004 | 48.14% | 6,121 | 49.08% | 346 | 2.77% | -117 | -0.94% | 12,471 | ||
| Rockingham | 6,451 | 48.86% | 6,552 | 49.63% | 200 | 1.51% | -101 | -0.76% | 13,203 | ||
| Strafford | 4,580 | 51.28% | 4,271 | 47.82% | 80 | 0.90% | 309 | 3.46% | 8,931 | ||
| Sullivan | 2,588 | 54.95% | 2,040 | 43.31% | 82 | 1.74% | 548 | 11.63% | 4,710 | ||
| Totals | 45,734 | 50.38% | 43,382 | 47.79% | 1,596 | 1.76% | 58[lower-alpha 2] | 0.06% | 2,352 | 2.59% | 90,770 |
Notes
- These figures differ somewhat from those in Dave Leip’s U.S. Election Atlas.
- These votes are not separated by county in the Géoelections data.
References
- Menendez, Albert J.; The Geography of Presidential Elections in the United States, 1868-2004, p. 257 ISBN 0786422173
- "1888 Presidential General Election Results - New Hampshire". U.S. Election Atlas. Retrieved 23 December 2013.
- Géoelections; Presidential election of 1888 Popular Vote (xlsx file for €15)
- Géoelections; Popular Vote for Clinton Fisk (xlsx file for €15)