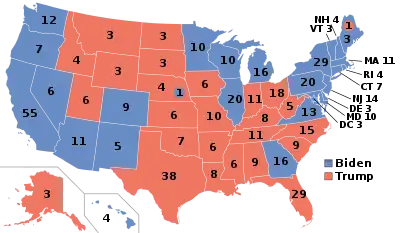
2020 United States presidential election in North Carolina
The 2020 United States presidential election in North Carolina was held on Tuesday, November 3, 2020, as part of the 2020 United States elections in which all 50 states plus the District of Columbia participated.[1] North Carolina voters chose electors to represent them in the Electoral College via a popular vote, pitting the Republican Party's nominee, incumbent President Donald Trump, and running mate Vice President Mike Pence against Democratic Party nominee, former Vice President Joe Biden, and his running mate California Senator Kamala Harris. North Carolina has 15 electoral votes in the Electoral College.[2]
| ||||||||||||||||||||||||||
| Turnout | 75.35% | |||||||||||||||||||||||||
|---|---|---|---|---|---|---|---|---|---|---|---|---|---|---|---|---|---|---|---|---|---|---|---|---|---|---|
| ||||||||||||||||||||||||||
 County Results
| ||||||||||||||||||||||||||
| ||||||||||||||||||||||||||
.jpg.webp)

| Elections in North Carolina |
|---|
 |
Polls of the state throughout the campaign indicated a close race. Prior to the election, most organizations considered the Tar Heel State either a tossup or leaning towards Biden. Despite this, Trump ultimately won North Carolina by a 1.34% margin over Biden. This was a closer margin than Trump's 3.67% margin over Hillary Clinton in 2016, and Mitt Romney's 2.04% margin over Barack Obama in 2012. In this election, North Carolina was 5.74% right of the nation as a whole. North Carolina last voted Democratic in 2008. Furthermore, it had last voted more Republican than neighboring Georgia in 2000.
The rural-urban divide was even more prevalent this election than in past elections. Biden carried eight of North Carolina's ten largest counties (losing only the Charlotte-area suburban counties of Union and Gaston), and overperformed Obama's 2008 margin in the six largest: Wake, Mecklenburg, Guilford, Forsyth, Durham, and Buncombe, in which he received 62%, 67%, 61%, 56%, 80%, and 60% of the vote, respectively.[3] Biden furthermore became the first Democrat to carry New Hanover County, home of Wilmington, since 1976, and held Trump to a single-digit margin in the Charlotte-area suburban county of Cabarrus, the first time since 1976 that the Republican margin in this county has been less than 10%.
On the other hand, Trump held, and outperformed his 2016 margin in, Robeson, Bladen, Martin, Granville and Gates counties, all counties that had been typically Democratic in the 20th century and which had voted for Obama twice before flipping to Trump in 2016. Biden thereby became the first Democrat ever to win the presidency without Robeson County, the largest county in the Lumber River region of the state and the county which had given Jimmy Carter his largest raw vote margin in the state in both 1976 and 1980. Trump picked off neighboring Scotland County, one of only 15 counties he flipped nationally, becoming the first Republican to carry it since 1984.
Primary elections
Presidential preference primaries were held on March 3, 2020 (First cases of COVID-19), for each of the political parties with state ballot access.
Democratic primary
Despite speculation that he might seek the Democratic nomination, Roy Cooper, the Governor of North Carolina, declined to run.[4][5]
%252C_2020.svg.png.webp)
- Biden—<30%
- Biden—30–40%
- Biden—40–50%
- Biden—50–60%
- Biden—60–70%
- Sanders—30–40%
- Sanders—40–50%
| Candidate | Votes | % | Delegates[7] |
|---|---|---|---|
| Joe Biden | 572,271 | 42.95 | 68 |
| Bernie Sanders | 322,645 | 24.22 | 37 |
| Michael Bloomberg | 172,558 | 12.95 | 3 |
| Elizabeth Warren | 139,912 | 10.50 | 2 |
| Pete Buttigieg (withdrawn†) | 43,632 | 3.27 | |
| Amy Klobuchar (withdrawn†) | 30,742 | 2.31 | |
| Tom Steyer (withdrawn†) | 10,679 | 0.80 | |
| Tulsi Gabbard | 6,622 | 0.50 | |
| Andrew Yang (withdrawn) | 2,973 | 0.22 | |
| Cory Booker (withdrawn) | 2,181 | 0.16 | |
| Michael Bennet (withdrawn) | 1,978 | 0.15 | |
| Deval Patrick (withdrawn) | 1,341 | 0.10 | |
| Marianne Williamson (withdrawn) | 1,243 | 0.09 | |
| John Delaney (withdrawn) | 1,098 | 0.08 | |
| Julian Castro (withdrawn) | 699 | 0.05 | |
| No Preference | 21,808 | 1.64 | |
| Total | 1,332,382 | 100% | 110 |
Republican primary
The North Carolina Republican Party submitted to the state only the name of incumbent President Donald Trump to be listed on the primary ballot. The campaign of Bill Weld "has written to the [state Board of Elections] asking to be added to the ballot, arguing that his candidacy meets the legal test because he’s received 'widespread news coverage,' raised more than $1.2 million, and has qualified for the primary ballot in six other states," according to the News and Observer.[8] Joe Walsh similarly petitioned the state board of elections. On Dec. 20, 2019, the state board unanimously voted to include both Weld and Walsh on the ballot.[9]
| Candidate | Votes | % | Delegates[11] |
|---|---|---|---|
| Donald Trump | 750,600 | 93.53 | 71 |
| Joe Walsh (withdrawn) | 16,356 | 2.04 | 0 |
| Bill Weld | 15,486 | 1.93 | 0 |
| No Preference | 20,085 | 2.50 | |
| Total | 802,527 | 100% | 71 |
Libertarian primary

| North Carolina Libertarian presidential primary, March 3, 2020[12] | ||
|---|---|---|
| Candidate | Votes | Percentage |
| None of the above | 2,060 | 30% |
| Jacob Hornberger | 604 | 9% |
| John McAfee | 570 | 8% |
| Kim Ruff (withdrawn) | 545 | 8% |
| Vermin Supreme | 410 | 6% |
| Ken Armstrong | 366 | 5% |
| Jo Jorgensen | 316 | 5% |
| Steve Richey | 278 | 4% |
| Adam Kokesh | 240 | 3% |
| Max Abramson | 236 | 3% |
| James Ogle | 232 | 3% |
| Kenneth Blevins | 199 | 3% |
| Dan Behrman | 194 | 3% |
| Jedidiah Hill | 194 | 3% |
| Souraya Faas | 193 | 3% |
| Erik Gerhardt | 150 | 2% |
| Arvin Vohra | 127 | 2% |
| Total | 6,914 | 100% |
Green primary
| Party | Candidate | Votes | % | |
|---|---|---|---|---|
| Green | Howie Hawkins | 247 | 60.54% | |
| Green | No Preference | 161 | 39.46% | |
| Total votes | 408 | 100% | ||
Constitution primary
| Party | Candidate | Votes | % | |
|---|---|---|---|---|
| Constitution | No Preference | 193 | 44.57% | |
| Constitution | Don Blankenship | 128 | 29.56% | |
| Constitution | Charles Kraut | 112 | 25.87% | |
| Total votes | 438 | 100% | ||
General election
Predictions
| Source | Ranking | As of |
|---|---|---|
| FiveThirtyEight[16] | Lean D (flip) | October 22, 2020 |
| Princeton Electoral Consortium[17] | Lean D (flip) | September 24, 2020 |
| The Cook Political Report[18] | Tossup | September 10, 2020 |
| Inside Elections[19] | Tilt D (flip) | October 28, 2020 |
| Sabato's Crystal Ball[20] | Lean D (flip) | November 2, 2020 |
| Politico[21] | Tossup | September 8, 2020 |
| RCP[22] | Tossup | August 3, 2020 |
| Niskanen[23] | Tossup | July 26, 2020 |
| CNN[24] | Tossup | August 3, 2020 |
| The Economist[25] | Tossup | September 2, 2020 |
| CBS News[26] | Tossup | August 16, 2020 |
| 270towin[27] | Tossup | August 2, 2020 |
| ABC News[28] | Tossup | July 31, 2020 |
| NPR[29] | Tossup | August 3, 2020 |
| NBC News[30] | Tossup | August 6, 2020 |
Polling
Graphical summary
Aggregate polls
| Source of poll aggregation |
Dates administered |
Dates updated |
Joe Biden Democratic |
Donald Trump Republican |
Other/ Undecided [lower-alpha 1] |
Margin |
|---|---|---|---|---|---|---|
| 270 to Win | October 22 – November 1, 2020 | November 2, 2020 | 47.8% | 47.5% | 4.7% | Biden +0.3 |
| Real Clear Politics | October 26 – November 1, 2020 | November 2, 2020 | 47.6% | 47.8% | 4.6% | Trump +0.2 |
| FiveThirtyEight | until November 1, 2020 | November 2, 2020 | 48.9% | 47.1% | 4.0% | Biden +1.8 |
| Average | 48.1% | 47.5% | 4.4% | Biden +0.6 | ||
June 1 – October 31, 2020
| Poll source | Date(s) administered |
Sample size[lower-alpha 2] |
Margin of error |
Donald Trump Republican |
Joe Biden Democratic |
Jo Jorgensen Libertarian |
Howie Hawkins Green |
Other | Undecided |
|---|---|---|---|---|---|---|---|---|---|
| SurveyMonkey/Axios | Oct 20 – Nov 2, 2020 | 5,363 (LV) | ± 2% | 48%[lower-alpha 3] | 50% | - | - | – | – |
| Change Research/CNBC | Oct 29 – Nov 1, 2020 | 473 (LV) | ± 4.51% | 47% | 49% | 2% | 1% | – | 1% |
| Swayable | Oct 27 – Nov 1, 2020 | 690 (LV) | ± 5.3% | 46% | 52% | 1% | 0% | – | – |
| Ipsos/Reuters | Oct 27 – Nov 1, 2020 | 707 (LV) | ± 4.2% | 48%[lower-alpha 4] | 49% | 1% | 1% | 2%[lower-alpha 5] | – |
| 48%[lower-alpha 6] | 49% | - | - | 3%[lower-alpha 7] | 1% | ||||
| 48%[lower-alpha 8] | 50% | - | - | 2%[lower-alpha 9] | – | ||||
| Data for Progress | Oct 27 – Nov 1, 2020 | 908 (LV) | ± 3.3% | 48% | 50% | 1% | 1% | 0%[lower-alpha 10] | – |
| Frederick Polls/Compete Everywhere[upper-alpha 1] | Oct 30–31, 2020 | 676 (LV) | ± 3.7% | 49% | 51% | - | - | – | – |
| AtlasIntel | Oct 30–31, 2020 | 812 (LV) | ± 3.0% | 50% | 48% | - | - | 3% | – |
| Insider Advantage/Center for American Greatness[upper-alpha 2] | Oct 30–31, 2020 | 450 (LV) | ± 4.6% | 48% | 44% | 2% | - | – | 7% |
| Emerson College | Oct 29–31, 2020 | 855 (LV) | ± 3.3% | 47%[lower-alpha 11] | 47% | - | - | 6%[lower-alpha 12] | – |
| Morning Consult | Oct 22–31, 2020 | 1,982 (LV) | ± 2% | 48% | 49% | - | - | – | – |
| CNN/SSRS | Oct 23–30, 2020 | 901 (LV) | ± 4.1% | 45% | 51% | 2% | 1% | 1%[lower-alpha 13] | 1% |
| Pulse Opinion Research/Rasmussen Reports | Oct 28–29, 2020 | 800 (LV) | ± 3.5% | 48% | 47% | - | - | 2%[lower-alpha 14] | – |
| Trafalgar Group | Oct 27–29, 2020 | 1,082 (LV) | ± 2.9% | 49% | 47% | 3% | - | 1%[lower-alpha 15] | 1% |
| Redfield & Wilton Strategies | Oct 26–29, 2020 | 1,489 (LV) | – | 47% | 49% | 2% | 0% | 0% | 2% |
| Harvard-Harris/The Hill | Oct 26–29, 2020 | 903 (LV) | – | 48% | 49% | - | - | – | 3% |
| East Carolina University | Oct 27–28, 2020 | 1,103 (LV) | ± 3.4% | 48%[lower-alpha 16] | 50% | - | - | 2%[lower-alpha 17] | 0%[lower-alpha 18] |
| Cardinal Point Analytics (R)/NSJ | Oct 27–28, 2020 | 750 (LV) | ± 3.6% | 48% | 46% | 1% | 1% | 2%[lower-alpha 19] | 2% |
| Marist College/NBC | Oct 25–28, 2020 | 800 (LV) | ± 4.7% | 46% | 52% | - | - | 2% | 1% |
| SurveyMonkey/Axios | Oct 1–28, 2020 | 8,720 (LV) | – | 47% | 52% | - | - | – | – |
| Gravis Marketing | Oct 26–27, 2020 | 614 (LV) | ± 4% | 46% | 49% | - | - | – | 4% |
| Public Policy Polling/Protect Our Care[upper-alpha 3] | Oct 26–27, 2020 | 937 (V) | ± 3.2% | 47% | 51% | - | - | – | 3% |
| Meeting Street Insights/Carolina Partnership for Reform (R) | Oct 24–27, 2020 | 600 (LV) | ± 4% | 45% | 48% | - | - | – | – |
| Siena College/NYT Upshot | Oct 23–27, 2020 | 1,034 (LV) | ± 3.4% | 45% | 48% | 2% | 1% | 0%[lower-alpha 20] | 4%[lower-alpha 21] |
| Ipsos/Reuters | Oct 21–27, 2020 | 647 (LV) | ± 4.4% | 48%[lower-alpha 4] | 49% | 1% | 1% | 1%[lower-alpha 22] | – |
| 48%[lower-alpha 23] | 49% | - | - | 2%[lower-alpha 24] | 1% | ||||
| RMG Research/PoliticalIQ | Oct 24–26, 2020 | 800 (LV) | ± 3.5% | 47%[lower-alpha 4] | 48% | - | - | 3%[lower-alpha 25] | 2% |
| 46%[lower-alpha 26] | 50% | - | - | 3%[lower-alpha 27] | 2% | ||||
| 49%[lower-alpha 28] | 47% | - | - | 3%[lower-alpha 29] | 2% | ||||
| Swayable | Oct 23–26, 2020 | 396 (LV) | ± 6.8% | 48% | 50% | 2% | 0% | – | – |
| SurveyUSA/WRAL-TV | Oct 23–26, 2020 | 627 (LV) | ± 4.9% | 48% | 48% | - | - | 2%[lower-alpha 30] | 2% |
| YouGov/UMass Amherst | Oct 20–26, 2020 | 911 (LV) | ± 4.2% | 48% | 48% | 1% | 0% | 1%[lower-alpha 31] | 2% |
| Wick Surveys | Oct 24–25, 2020 | 1,000 (LV) | ± 3.1% | 49% | 47% | - | - | – | – |
| Harper Polling/Civitas (R) | Oct 22–25, 2020 | 504 (LV) | ± 4.37% | 46% | 47% | 1% | 0% | 0%[lower-alpha 32] | 6% |
| YouGov/CBS | Oct 20–23, 2020 | 1,022 (LV) | ± 4.1% | 47% | 51% | – | – | 2%[lower-alpha 33] | 0% |
| Trafalgar Group | Oct 20–22, 2020 | 1,098 (LV) | ± 2.9% | 48.8% | 46% | 2.3% | 0.4% | 0.8%[lower-alpha 34] | 1.7% |
| Citizen Data | Oct 17–20, 2020 | 1000 (LV) | ± 3.1% | 44% | 50% | 1% | 0.2% | 1.3% | 3.6% |
| Pulse Opinion Research/Rasmussen Reports | Oct 20–21, 2020 | 800 (LV) | ± 3.5% | 48% | 47% | - | - | 2%[lower-alpha 35] | 3% |
| Ipsos/Reuters | Oct 14–20, 2020 | 660 (LV) | ± 4.3% | 47%[lower-alpha 4] | 49% | 1% | 1% | 1%[lower-alpha 36] | – |
| 46%[lower-alpha 37] | 49% | - | - | 2%[lower-alpha 38] | 2% | ||||
| Morning Consult | Oct 11–20, 2020 | 1,904 (LV) | ± 2.2% | 47% | 50% | - | - | – | – |
| Meredith College | Oct 16–19, 2020 | 732 (LV) | ± 3.5% | 44% | 48% | 1% | 1% | 0%[lower-alpha 39] | 4% |
| Change Research/CNBC | Oct 16–19, 2020 | 521 (LV)[lower-alpha 40] | – | 47% | 50% | - | - | – | – |
| Data for Progress (D) | Oct 15–18, 2020 | 929 (LV) | ± 3.2% | 44% | 48% | 1% | 1% | – | 5% |
| East Carolina University | Oct 15–18, 2020 | 1,155 (LV) | ± 3.4% | 47%[lower-alpha 41] | 51% | - | - | 2%[lower-alpha 42] | 0% |
| ABC/Washington Post | Oct 12–17, 2020 | 646 (LV) | ± 4.5% | 48%[lower-alpha 4] | 49% | 1% | 0%[lower-alpha 43] | 0%[lower-alpha 44] | 1% |
| 48%[lower-alpha 45] | 50% | - | - | 0%[lower-alpha 46] | 1% | ||||
| Emerson College | Oct 11–14, 2020 | 721 (LV) | ± 3.6% | 49%[lower-alpha 47] | 49% | - | - | 2%[lower-alpha 48] | – |
| Civiqs/Daily Kos | Oct 11–14, 2020 | 1,211 (LV) | ± 3.3% | 46% | 51% | - | - | 2%[lower-alpha 49] | 1% |
| Redfield & Wilton Strategies | Oct 10–13, 2020 | 994 (LV) | – | 46%[lower-alpha 40] | 49% | 1% | 0% | – | – |
| Siena College/NYT Upshot | Oct 9–13, 2020 | 627 (LV) | ± 4.5% | 42% | 46% | 2% | 1% | 1%[lower-alpha 50] | 8%[lower-alpha 51] |
| Ipsos/Reuters | Oct 7–13, 2020 | 660 (LV) | ± 4.3% | 48%[lower-alpha 4] | 48% | 2% | 0% | 1%[lower-alpha 52] | – |
| 47%[lower-alpha 53] | 48% | - | - | 3%[lower-alpha 54] | 3% | ||||
| Monmouth University | Oct 8–11, 2020 | 500 (RV) | ± 4.4% | 46% | 49% | 3% | 0% | 0%[lower-alpha 55] | 2% |
| 500 (LV)[lower-alpha 56] | 46% | 50% | - | - | 2% | 2% | |||
| 500 (LV)[lower-alpha 57] | 48% | 49% | - | - | 2% | 1% | |||
| SurveyUSA/WRAL-TV | Oct 8–11, 2020 | 669 (LV) | ± 4.8% | 45% | 50% | - | - | 2%[lower-alpha 58] | 3% |
| Susquehanna Polling & Research Inc./American Greatness PAC[upper-alpha 2] | Oct 7–11, 2020 | 500 (LV) | ± 4.3% | 46% | 48% | 2% | - | 1%[lower-alpha 59] | 4% |
| RMG Research/PoliticalIQ | Oct 7–11, 2020 | 800 (LV) | – | 45%[lower-alpha 4] | 47% | 2% | 1% | 1% | 4% |
| 43%[lower-alpha 60] | 49% | 2% | 1% | 1% | 4% | ||||
| 47%[lower-alpha 61] | 44% | 2% | 1% | 1% | 4% | ||||
| Morning Consult | Oct 2–11, 2020 | 1,993 (LV) | ± 2.2% | 46% | 50% | - | - | – | – |
| YouGov/CCES | Sep 29 – Oct 7, 2020 | 1,627 (LV) | – | 45% | 49% | - | - | – | – |
| Redfield & Wilton Strategies | Oct 9–10 | 750 (LV) | – | 42%[lower-alpha 40] | 49% | 1% | 0% | – | – |
| Redfield & Wilton Strategies | Oct 4–6, 2020 | 938 (LV) | ± 3.2% | 44% | 49% | 1% | 0% | 0%[lower-alpha 62] | 5% |
| Ipsos/Reuters | Sep 29 – Oct 6, 2020 | 693 (LV) | ± 4.2% | 47% | 47% | - | - | 2%[lower-alpha 63] | 3% |
| Public Policy Polling | Oct 4–5, 2020 | 911 (V) | – | 46% | 50% | - | - | – | 3% |
| Data For Progress (D) | Sep 30 - Oct 5, 2020 | 1,285 (LV) | ± 2.7% | 44% | 51% | 2% | 0% | – | 3% |
| Change Research/CNBC | Oct 2–4, 2020 | 396 (LV) | – | 47% | 49% | - | - | – | – |
| East Carolina University | Oct 2–4, 2020 | 1,232 (LV) | ± 3.2% | 46% | 50% | - | - | 2%[lower-alpha 64] | 2% |
| SurveyMonkey/Axios | Sep 1–30, 2020 | 3,495 (LV) | – | 46% | 52% | - | - | – | 2% |
| ALG Research/Piedmont Rising[upper-alpha 4] | Sep 22–28, 2020 | 822 (V) | – | 47% | 50% | - | - | – | – |
| Hart Research Associates/Human Rights Campaign[upper-alpha 5] | Sep 24–27, 2020 | 400 (LV) | ± 4.9% | 47% | 49% | - | - | – | – |
| Redfield & Wilton Strategies | Sep 23–26, 2020 | 1,097 (LV) | ± 2.96% | 45% | 47% | 2% | 0% | 1%[lower-alpha 65] | 6% |
| YouGov/CBS | Sep 22–25, 2020 | 1,213 (LV) | ± 3.6% | 46% | 48% | - | - | 2%[lower-alpha 66] | 4% |
| YouGov/UMass Lowell | Sep 18–25, 2020 | 921 (LV) | ± 4.1% | 47%[lower-alpha 4] | 47% | 2% | 1% | 0%[lower-alpha 67] | 2% |
| 49%[lower-alpha 68] | 48% | - | - | 2%[lower-alpha 69] | 2% | ||||
| Meredith College | Sep 18–22, 2020 | 705 (RV) | ± 3.5% | 45% | 46% | 2% | 0% | 1%[lower-alpha 70] | 6% |
| Change Research/CNBC | Sep 18–20, 2020 | 579 (LV) | – | 46% | 48% | - | - | – | – |
| Harper Polling/Civitas (R) | Sep 17–20, 2020 | 612 (LV) | ± 3.96% | 45% | 44% | 2% | 0% | 0%[lower-alpha 71] | 8% |
| Emerson College | Sep 16–18, 2020 | 717 (LV) | ± 3.6% | 49%[lower-alpha 72] | 51% | - | - | – | – |
| Siena College/NYT Upshot | Sep 11–16, 2020 | 653 (LV) | ± 4.3% | 44% | 45% | 2% | 1% | 0%[lower-alpha 73] | 8%[lower-alpha 74] |
| Ipsos/Reuters | Sep 11–16, 2020 | 586 (LV) | ± 4.6% | 47% | 47% | - | - | 3%[lower-alpha 75] | 3% |
| Redfield & Wilton Strategies | Sep 12–15, 2020 | 1,092 (LV) | ± 2.97% | 45% | 47% | 1% | 1% | 0%[lower-alpha 76] | 5% |
| Suffolk University/USA Today | Sep 11–14, 2020 | 500 (LV) | – | 42.8% | 46.2% | 4.8% | 0.2% | 1.8%[lower-alpha 77] | 4.2% |
| SurveyUSA/WRAL TV | Sep 10–13, 2020 | 596 (LV) | ± 5.6% | 47% | 47% | - | - | 2%[lower-alpha 78] | 5% |
| CNN/SSRS | Sep 9–13, 2020 | 787 (LV) | ± 3.9% | 46% | 49% | 2% | 1% | 0%[lower-alpha 79] | 2% |
| Kaiser Family Foundation/Cook Political Report | Aug 29 – Sep 13, 2020 | 1,172 (RV) | ± 3% | 43% | 45% | - | - | 4%[lower-alpha 80] | 9% |
| Trafalgar | Sep 9–11, 2020 | 1,046 (LV) | ± 3% | 47.8% | 46.1% | 1.6% | 0.5% | 1.5%[lower-alpha 81] | 2.5% |
| Pulse Opinion Research/Rasmussen Reports | Sep 7–8, 2020 | 1,000 (LV) | ± 3% | 49%[lower-alpha 82] | 48% | - | - | 3%[lower-alpha 83] | – |
| Benenson Strategy Group/GS Group/AARP | Aug 28 – Sep 8, 2020 | 1,600 (LV) | ± 2.5% | 48% | 48% | - | - | 1%[lower-alpha 84] | 4% |
| Morning Consult | Aug 29 – Sep 7, 2020 | 1,592 (LV) | ± (2%-4%) | 47%[lower-alpha 85] | 48% | - | - | – | – |
| Change Research/CNBC | Sep 4–6, 2020 | 442 (LV) | – | 47% | 49% | - | - | 4%[lower-alpha 86] | – |
| Redfield & Wilton Strategies | Aug 30 – Sep 3, 2020 | 951 (LV) | ± 3.18% | 44% | 43% | 1% | 1% | 1%[lower-alpha 87] | 9% |
| Monmouth University | Aug 29 – Sep 1, 2020 | 401 (RV) | ± 4.9% | 45% | 47% | 3% | 0% | 1%[lower-alpha 88] | 3% |
| 401 (LV)[lower-alpha 89] | 46% | 48% | - | - | 3% | 3% | |||
| 401 (LV)[lower-alpha 90] | 46% | 48% | - | - | 3% | 3% | |||
| Fox News | Aug 29 – Sep 1, 2020 | 722 (LV) | ± 3.5% | 46% | 50% | 1% | 0% | 0%[lower-alpha 91] | 2% |
| 804 (RV) | ± 3.5% | 45% | 49% | 2% | 1% | 2%[lower-alpha 92] | 3% | ||
| SurveyMonkey/Axios | Aug 1–31, 2020 | 2,914 (LV) | – | 51% | 48% | - | - | – | 2% |
| East Carolina University | Aug 29–30, 2020 | 1,101 (LV) | ± 3.4% | 49% | 47% | - | - | 2%[lower-alpha 93] | 3% |
| Morning Consult | Aug 21–30, 2020 | 1,567 (LV) | ± (2%–4%) | 47% | 49% | - | - | – | – |
| Change Research/CNBC | Aug 21–23, 2020 | 560 (LV) | – | 47% | 48% | – | – | – | – |
| Morning Consult | Aug 14–23, 2020 | 1,541 (LV) | ± 2.0% | 46% | 49% | – | – | 1%[lower-alpha 94] | 3% |
| Redfield & Wilton Strategies | Aug 16–17, 2020 | 967 (LV) | ± 3.09% | 46% | 44% | 2% | 0% | 1%[lower-alpha 95] | 7% |
| Morning Consult | Aug 7–16, 2020 | 1,493 (LV) | ± (2%–4%) | 46% | 49% | - | - | – | – |
| East Carolina University | Aug 12–13, 2020 | 1,255 (RV) | ± 3.2% | 47% | 47% | – | – | 3%[lower-alpha 96] | 4% |
| Emerson College | Aug 8–10, 2020 | 673 (LV) | ± 3.8% | 51%[lower-alpha 97] | 49% | – | – | – | – |
| Harper Polling/Civitas | Aug 6–10, 2020 | 600 (LV) | ± 4.0% | 44% | 45% | 2% | 1% | 1%[lower-alpha 98] | 7% |
| Change Research/CNBC | Aug 7–9, 2020 | 493 (LV) | – | 48% | 47% | – | – | – | – |
| Pulse Opinion Research/Rasmussen Reports/American Greatness PAC[upper-alpha 2] | Aug 6–8, 2020 | 750 (LV) | ± 3.6% | 48%[lower-alpha 40] | 47% | – | – | – | – |
| Data for Progress | Jul 24 – Aug 2, 2020 | 1,170 (LV) | – | 45% | 49% | – | – | – | 6% |
| 44% | 46% | 2% | 1% | – | 7% | ||||
| Public Policy Polling/Giffords[upper-alpha 6] | Jul 30–31, 2020 | 934 (V) | – | 46% | 49% | – | – | – | 6% |
| YouGov/CBS | Jul 28–31, 2020 | 1,129 (LV) | ± 3.9% | 44% | 48% | – | – | 2%[lower-alpha 99] | 5% |
| HIT Strategies/DFER[upper-alpha 7] | Jul 23–31, 2020 | 400 (RV) | ± 4.9% | 37% | 47% | – | – | 4%[lower-alpha 100] | 10%[lower-alpha 101] |
| SurveyMonkey/Axios | Jul 1–31, 2020 | 3,466 (LV) | – | 50% | 49% | - | - | – | 2% |
| Change Research/CNBC | Jul 24–26, 2020 | 284 (LV) | – | 46% | 49% | – | – | – | – |
| Morning Consult | Jul 17–26, 2020 | 1,504 (LV) | ± 2.5% | 47% | 47% | – | – | – | – |
| Public Policy Polling/AFSCME[upper-alpha 8] | Jul 23–24, 2020 | 884 (V) | – | 46% | 49% | – | – | – | 5% |
| Cardinal Point Analytics | Jul 22–24, 2020 | 735 (LV) | ± 3.6% | 48% | 47% | 1% | – | – | 4% |
| Zogby Analytics | Jul 21–23, 2020 | 809 (RV) | ± 3.4% | 40% | 44% | 4% | 1% | – | 11% |
| Marist College/NBC News | Jul 14–22, 2020 | 882 (RV) | ± 4.0% | 44% | 51% | – | – | 2% | 4% |
| Redfield & Wilton Strategies | Jul 19–21, 2020 | 919 (LV) | – | 42% | 43% | 2% | 1% | 1% | 11% |
| Spry Strategies/American Principles Project[upper-alpha 9] | Jul 11–16, 2020 | 600 (LV) | ± 3.7% | 49% | 46% | – | – | – | 5% |
| Cardinal Point Analytics | Jul 13–15, 2020 | 547 (LV) | ± 4.2% | 49% | 48% | 1% | – | – | 3% |
| Change Research/CNBC | Jul 10–12, 2020 | 655 (LV) | – | 46% | 47% | – | – | – | – |
| Public Policy Polling | Jul 7–8, 2020 | 818 (V) | ± 3.4% | 46% | 50% | – | – | – | 5% |
| SurveyMonkey/Axios | Jun 8–30, 2020 | 1,498 (LV) | – | 49% | 49% | - | - | – | 1% |
| Change Research/CNBC | Jun 26–28, 2020 | 468 (LV)[lower-alpha 40] | – | 44% | 51% | – | – | – | – |
| East Carolina University | Jun 22–25, 2020 | 1,149 (RV) | ± 3.4% | 44% | 45% | – | – | 7%[lower-alpha 102] | 4% |
| Public Policy Polling | Jun 22–23, 2020 | 1,157 (V) | – | 46% | 48% | – | – | – | 6% |
| Fox News | Jun 20–23, 2020 | 1,012 (RV) | ± 3% | 45% | 47% | – | – | 5%[lower-alpha 103] | 3% |
| NYT Upshot/Siena College | Jun 8–18, 2020 | 653 (RV) | ± 4.1% | 40% | 49% | – | – | 4%[lower-alpha 104] | 7% |
| Gravis Marketing/OANN | Jun 17, 2020 | 631 (RV) | ± 3.9% | 46% | 43% | – | – | – | 10% |
| Redfield & Wilton Strategies | Jun 14–17, 2020 | 902 (LV) | ± 3.26% | 40% | 46% | 1% | 0% | 1% | 11% |
| Change Research/CNBC | Jun 12–14, 2020 | 378 (LV)[lower-alpha 40] | – | 45% | 47% | 1% | 1% | – | – |
| Public Policy Polling | Jun 2–3, 2020 | 913 (V) | ± 3.2% | 45% | 49% | – | – | – | 6% |
January 1, 2020 – May 31, 2020
| Poll source | Date(s) administered |
Sample size[lower-alpha 2] |
Margin of error |
Donald Trump (R) |
Joe Biden (D) |
Other | Undecided |
|---|---|---|---|---|---|---|---|
| Change Research/CNBC | May 29–31, 2020 | 806 (LV) | – | 45% | 46% | 4% | 4% |
| Harper Polling/Civitas | May 26–28, 2020 | 500 (LV) | ± 4.38% | 47% | 44% | – | 9% |
| Morning Consult | May 17–26, 2020 | 1,403 (LV) | – | 49% | 46% | – | – |
| Neighbourhood Research & Media | May 12–21, 2020 | 391 (LV) | – | 42% | 42% | – | – |
| Redfield & Wilton Strategies | May 10–14, 2020 | 859 (LV) | ± 3.3% | 43% | 45% | 3%[lower-alpha 105] | 8% |
| Meeting Street Insights (R) | May 9–13, 2020 | 500 (RV) | – | 47% | 47% | – | 6% |
| East Carolina University | May 7–9, 2020 | 1,111 (RV) | ± 3.4% | 46% | 43% | 7%[lower-alpha 106] | 4% |
| Civiqs/Daily Kos | May 2–4, 2020 | 1,362 (RV) | ± 3% | 46% | 49% | 4%[lower-alpha 107] | 2% |
| Meredith College | Apr 27–28, 2020 | 604 (RV) | ± 4.0% | 40% | 47% | 5%[lower-alpha 108] | 7% |
| SurveyUSA | Apr 23–26, 2020 | 580 (LV) | ± 5.5% | 45% | 50% | – | 5% |
| Public Policy Polling[upper-alpha 10] | Apr 20–21, 2020 | 1,275 (RV) | – | 46% | 49% | – | 5% |
| Garin-Hart-Yang/Put NC First (D) | Apr 13–18, 2020 | 800 (LV) | – | 45% | 48% | – | – |
| GBAO Strategies/PLUS Paid Family Leave | Apr 13–16, 2020 | 500 (LV) | – | 46% | 48% | 1% | 4% |
| Public Policy Polling | Apr 14–15, 2020 | 1,318 (V) | – | 47% | 48% | – | 5% |
| Harper Polling | Apr 5–7, 2020 | 500 (LV) | ± 4.4% | 49% | 42% | – | 9% |
| East Carolina University | Feb 27–28, 2020 | 1,288 (RV) | ± 3.2% | 46% | 48% | – | – |
| NBC News/Marist College | Feb 23–27, 2020 | 2,120 (RV) | ± 2.4% | 45% | 49% | 1% | 5% |
| SurveyUSA | Feb 13–16, 2020 | 2,366 (RV) | ± 2.5% | 45% | 49% | – | 6% |
| Climate Nexus | Feb 11–15, 2020 | 675 (RV) | ± 3.9% | 44% | 46% | – | 11% |
January 1, 2018 – December 31, 2019
| Poll source | Date(s) administered |
Sample size[lower-alpha 2] |
Margin of error |
Donald Trump (R) |
Joe Biden (D) |
Other | Undecided |
|---|---|---|---|---|---|---|---|
| Fox News | Nov 10–13, 2019 | 1,504 (RV) | ± 2.5% | 43% | 45% | 5% | 5% |
| NYT Upshot/Siena College | Oct 13–26, 2019 | 651 (LV) | ± 4.4% | 48% | 46% | – | – |
| East Carolina University | Oct 2–9, 2019 | 1,076 (RV) | ± 3.0% | 46% | 50% | 4% | –[lower-alpha 109] |
| Meredith College | Sep 29 – Oct 7, 2019 | 996 (RV) | ± 3.0% | 38% | 35% | 20%[lower-alpha 110] | 7% |
| Public Policy Polling | Oct 4–6, 2019 | 963 (V) | ± 3.2% | 46% | 51% | – | 4% |
| SurveyUSA | Aug 1–5, 2019 | 2,113 (RV) | ± 2.7% | 41% | 49% | – | 10% |
| Harper Polling | Aug 1–4, 2019 | 500 (LV) | ± 4.4% | 45% | 44% | – | 11% |
| Fabrizio Ward/AARP | Jul 29–31, 2019 | 600 (LV) | ± 4.0% | 45% | 49% | – | 5% |
| Public Policy Polling | Jun 17–18, 2019 | 610 (RV) | ± 4.0% | 46% | 49% | – | 5% |
| Emerson College | May 31 – Jun 3, 2019 | 932 (RV) | ± 3.1% | 44% | 56% | – | – |
| Spry Strategies (R)[upper-alpha 11] | May 25 – Jun 1, 2019 | 730 (LV) | – | 52% | 41% | – | 7% |
| Harper Polling | Feb 11–13, 2019 | 500 (LV) | ± 4.4% | 43% | 39% | 7% | 11% |
| Public Policy Polling | Jan 4–7, 2019 | 750 (RV) | ± 3.6% | 44% | 49% | – | 7% |
| Meredith College | Jan 21–25, 2018 | 621 (RV) | ± 4.0% | 45% | 46% | 8% | 1% |
Former candidates | ||||||||||||||||||||||||||||||||||||||||||||||||||||||||||||||||||||||||||||||||||||||||||||||||||||||||||||||||||||||||||||||||||||||||||||||||||||||||||||||||||||||||||||||||||||||||||||||||||||||||||||||||||||||||||||||||||||||||||||||||||||||||||||||||||||||||||||||||||||||||||||||||||||||||||||||||||||||||||||||||||||||||||||||||||||||||||||||||||||||||||||||||||||||||||||||||||||||||||||||||||||||||||||||||||||||||||||||||||||||||||||||||||||||||||||||||||||||||||||||||||||||||||||||||||||||||||||||||
|---|---|---|---|---|---|---|---|---|---|---|---|---|---|---|---|---|---|---|---|---|---|---|---|---|---|---|---|---|---|---|---|---|---|---|---|---|---|---|---|---|---|---|---|---|---|---|---|---|---|---|---|---|---|---|---|---|---|---|---|---|---|---|---|---|---|---|---|---|---|---|---|---|---|---|---|---|---|---|---|---|---|---|---|---|---|---|---|---|---|---|---|---|---|---|---|---|---|---|---|---|---|---|---|---|---|---|---|---|---|---|---|---|---|---|---|---|---|---|---|---|---|---|---|---|---|---|---|---|---|---|---|---|---|---|---|---|---|---|---|---|---|---|---|---|---|---|---|---|---|---|---|---|---|---|---|---|---|---|---|---|---|---|---|---|---|---|---|---|---|---|---|---|---|---|---|---|---|---|---|---|---|---|---|---|---|---|---|---|---|---|---|---|---|---|---|---|---|---|---|---|---|---|---|---|---|---|---|---|---|---|---|---|---|---|---|---|---|---|---|---|---|---|---|---|---|---|---|---|---|---|---|---|---|---|---|---|---|---|---|---|---|---|---|---|---|---|---|---|---|---|---|---|---|---|---|---|---|---|---|---|---|---|---|---|---|---|---|---|---|---|---|---|---|---|---|---|---|---|---|---|---|---|---|---|---|---|---|---|---|---|---|---|---|---|---|---|---|---|---|---|---|---|---|---|---|---|---|---|---|---|---|---|---|---|---|---|---|---|---|---|---|---|---|---|---|---|---|---|---|---|---|---|---|---|---|---|---|---|---|---|---|---|---|---|---|---|---|---|---|---|---|---|---|---|---|---|---|---|---|---|---|---|---|---|---|---|---|---|---|---|---|---|---|---|---|---|---|---|---|---|---|---|---|---|---|---|---|---|---|---|---|---|---|---|---|---|---|---|---|---|---|---|---|---|---|---|---|---|---|---|---|---|---|---|---|---|---|---|---|---|---|---|---|---|---|---|---|---|---|---|---|---|---|---|---|---|---|---|---|---|---|---|---|---|---|---|---|---|---|---|---|---|---|---|---|---|---|---|---|---|---|---|---|---|---|---|---|---|---|---|---|---|---|---|---|---|---|---|---|---|---|---|---|---|---|---|---|---|---|---|---|---|---|---|---|---|---|---|---|---|---|---|---|---|---|---|---|---|---|---|---|---|
|
Donald Trump vs. Michael Bloomberg
Donald Trump vs. Cory Booker
Donald Trump vs. Pete Buttigieg
Donald Trump vs. Kirsten Gillibrand
Donald Trump vs. Kamala Harris
Donald Trump vs. Amy Klobuchar
Donald Trump vs. Beto O'Rourke
Donald Trump vs. Bernie Sanders
Donald Trump vs. Elizabeth Warren
|
Hypothetical polling | ||||||||||||||||||||||||||||||||||||||||||||||||||||||||||||||||||||||||||||||||||||||||||||||||||||||||||||||||||||||
|---|---|---|---|---|---|---|---|---|---|---|---|---|---|---|---|---|---|---|---|---|---|---|---|---|---|---|---|---|---|---|---|---|---|---|---|---|---|---|---|---|---|---|---|---|---|---|---|---|---|---|---|---|---|---|---|---|---|---|---|---|---|---|---|---|---|---|---|---|---|---|---|---|---|---|---|---|---|---|---|---|---|---|---|---|---|---|---|---|---|---|---|---|---|---|---|---|---|---|---|---|---|---|---|---|---|---|---|---|---|---|---|---|---|---|---|---|---|---|
|
with Donald Trump and Michelle Obama
with Donald Trump and Oprah Winfrey
with Donald Trump and a person whose name was randomly chosen out of a phone book
with Donald Trump and Roy Cooper
with Donald Trump and Generic Democrat
with Donald Trump and Generic Opponent
|
Results
| Party | Candidate | Votes | % | ±% | |
|---|---|---|---|---|---|
| Republican | Donald Trump Mike Pence |
2,758,775 | 49.93% | +0.10% | |
| Democratic | Joe Biden Kamala Harris |
2,684,292 | 48.59% | +2.42% | |
| Libertarian | Jo Jorgensen Spike Cohen |
48,678 | 0.88% | -1.86% | |
| Green | Howie Hawkins Angela Walker |
12,195 | 0.22% | -0.04% | |
| Constitution | Don Blankenship William Mohr |
7,549 | 0.14% | ||
| Write-in | 13,315 | 0.24% | |||
| Total votes | 5,524,804 | 100.00% | |||
Counties that flipped from Democratic to Republican
- Scotland (largest municipality: Laurinburg)
Counties that flipped from Republican to Democratic
- Nash (largest municipality: Rocky Mount)
- New Hanover (largest municipality: Wilmington)
See also
- United States presidential elections in North Carolina
- 2020 North Carolina elections
- 2020 United States presidential election
- 2020 Democratic Party presidential primaries
- 2020 Republican Party presidential primaries
- 2020 Libertarian Party presidential primaries
- 2020 Green Party presidential primaries
- 2020 United States elections
Notes
- General footnotes
- Calculated by taking the difference of 100% and all other candidates combined.
- Key:
A – all adults
RV – registered voters
LV – likely voters
V – unclear - Overlapping sample with the previous SurveyMonkey/Axios poll, but more information available regarding sample size
- Standard VI response
- "Some other candidate" and West (B) with 1%; would not vote with 0%
- If only Biden, Trump and "some other candidate" were available
- "Some other candidate" with 3%; would not vote with 0%
- Results considering those who lean towards a given candidate among those initially predisposed towards abstention, indecision or a candidate besides Biden or Trump in the response section immediately above
- "Some other candidate" with 2%
- "Other candidate or write-in" with 0%
- With voters who lean towards a given candidate
- "Someone else" with 6%
- "None of these" with 1%; "Other" with 0%
- "Some other candidate" with 2%
- "Someone else" with 1%
- With voters who lean towards a given candidate
- "Some other candidate" with 2%; did/would not vote and "Refused" with 0%
- No voters
- Blankenship (C) with 2%
- "Someone else" and would not vote with 0%
- Includes "Refused"
- "Some other candidate" with 1%; West (B) and would not vote with 0%
- If only Biden, Trump and "Some other candidate" were available
- "Some other candidate" with 2%; would not vote with 0%
- "Another candidate" with 3%
- Results generated with high Democratic turnout model
- "Another candidate" with 3%
- Results generated with high Republican turnout model
- "Another candidate" with 3%
- "Some other candidate" with 2%
- "Another candidate" with 1%
- Blankenship (C) with no voters
- "Other third party" with 2%
- "Someone else" with 0.6%; Blankenship (C) with 0.2%
- "Some other candidate" with 2%
- "Some other candidate" with 1%; West (B) and would not vote with 0%
- If only Biden, Trump and "Some other candidate" were available
- "Some other candidate" with 2%; would not vote with 0%
- Blankenship (C) with 0%
- Additional data sourced from FiveThirtyEight
- With voters who lean towards a given candidate
- "Some other candidate" with 1%; did/would not vote and "Refused" with 0%
- No voters
- "Other", "None of these" and would not vote with 0%
- If only Biden and Trump were candidates
- "Other", "None of these" and would not vote with 0%
- With voters who lean towards a given candidate
- "Someone else" with 2%
- "Someone else" with 2%
- "Someone else" with 1%; would not vote with 0%
- Includes "Refused"
- "Some other candidate" with 1%; West (B) and would not vote with 0%
- If only Biden, Trump and "Some other candidate" were available
- "Some other candidate" with 3%; would not vote with 0%
- Blankenship (C), "No one" and "Other candidate" with no voters
- With a likely voter turnout model featuring high turnout
- With a likely voter turnout model featuring low turnout
- "Some other candidate" with 2%
- "Refused" with 1%; "Other" with 0%
- Results generated with high Democratic turnout model
- Results generated with high Republican turnout model
- "Another Third Party/Write-in" with 0%
- "Some other candidate" with 2%; would not vote with 0%
- "Some other candidate" with 2%; would not vote with no voters
- "Another Third Party/Write-in" with 1%
- "Someone else/third party" with 2%
- "Another candidate" with 0%
- With only Biden, Trump and "another candidate" as options
- "Another candidate" with 2%
- Blankenship (C) with 1%
- Blankenship (C) with 0%
- With voters who lean towards a given candidate
- "Someone else" and would not vote with 0%
- Includes "Refused"
- "Some other candidate" with 3%; would not vote with 0%
- "Another Third Party/Write-in" with 0%
- "Refused" with 1.4%; "Other" with 0.4%; Blankenship (C) with no voters
- "Some other candidate" with 2%
- "None of these" and "Other" with 0%; Blankenship (C) with no voters
- "Someone else" with 3%; would not vote with 1%; "refused" with 0%
- "Someone else" with 1%; Blankenship (C) with 0.5%
- With voters who lean towards a given candidate
- "Some other candidate" with 3%
- Would not vote with 1%
- Overlapping sample with the previous Morning Consult poll, but more information available regarding sample size
- "Other/not sure" with 4%
- "Another Third Party/Write-in" with 1%
- "No one" with 1%; Blankenship and "Other candidate" with <1%
- With a likely voter turnout model featuring higher turnout than in the 2016 presidential election
- With a likely voter turnout model featuring lower turnout than in the 2016 presidential election
- Blankenship (C) and "Other" with 0%
- Blankenship (C) and would not vote with 1%; "Other" with 0%
- "Some other candidate" with 2%
- "Someone else" with 1%
- "Another third party/write-in" with 1%
- "Other candidate" with 3%
- Including voters who lean towards a given candidate
- Blankenship (C) with 1%
- "Someone else/third party" with 2%; would not vote with 0%
- "Third party candidate" with 3%; would not vote with 1%
- Includes "refused"
- "Some other candidate" with 7%
- "Other" with 3%; would not vote with 2%
- "Another candidate" with 3%; would not vote with 1%
- "Third party/write-in" with 3%
- "Other candidate" with 7%
- "Someone else" with 4%
- "Someone else" with 5%
- The poll does not have a separate listing for this entry, which is instead added into the 'Other' grouping.
- Refused/no answer with 0.2%
- Refused/no answer with 0.1%
- Refused/no answer with 0.1%
- Refused/no answer with 0.1%
- Refused/no answer with 0.1%
- "Someone else" with 6%
- "Other/it depends" with 6%; "Don't know" with 3%
- "It is time for someone else to be President" with 51% as opposed to "Trump should be re-elected if he is the Republican nominee"
- Partisan clients
- Compete Everywhere primarily supports Democratic candidates
- The Center for American Greatness is a pro-Trump organization
- Poll sponsored by Protect Our Care, a pro-Affordable Care Act organisation
- Piedmont Rising is a pro-Affordable Care Act organisation
- The Human Rights Campaign endorsed Biden prior to this poll's sampling period
- The founder of this poll's sponsor had endorsed Biden prior to the sampling period
- This poll’s sponsor, DFER, primarily supports Democratic candidates
- AFSCME endorsed Biden prior to this poll's sampling period
- This poll's sponsor is the American Principles Project, a 501(c)(4) organization that supports the Republican Party.
- Poll sponsored by Protect Our Care, a pro-Affordable Care Act organisation
- Poll sponsored by the North Carolina Republican Party
- Poll sponsored by the Civitas Institute, a conservative think tank
- Poll sponsored by End Citizens United, a group that has exclusively endorsed Democrats
- Poll sponsored by End Citizens United, a group that has exclusively endorsed Democrats
References
- Kelly, Ben (August 13, 2018). "US elections key dates: When are the 2018 midterms and the 2020 presidential campaign?". The Independent. Retrieved January 3, 2019.
- "Distribution of Electoral Votes". National Archives and Records Administration. Retrieved January 3, 2019.
- "North Carolina Election Results". The New York Times. November 3, 2020. ISSN 0362-4331. Retrieved December 11, 2020.
- Dovere, Edward-Isaac (July 18, 2017). "Can Roy Cooper Show Democrats How to Win Again?". Politico. Retrieved August 28, 2017.
- Moody, Aaron; Specht, Paul A. (March 29, 2018). "Roy Cooper for president? 'I'm sure I'll get some calls.'". The News & Observer. Retrieved July 5, 2018.
- "NC SBE Contest Results". er.ncsbe.gov. North Carolina State Board of Elections. Retrieved March 11, 2020.
- "North Carolina Election Results 2020". PBS NewsHour. Retrieved March 11, 2020.
- News and Observer
- WRAL.com
- "NC SBE Contest Results". er.ncsbe.gov. North Carolina State Board of Elections. Retrieved March 11, 2020.
- "North Carolina Election Results 2020". PBS NewsHour. Retrieved March 11, 2020.
- "LOCAL ELECTIONS". ABC 11. March 3, 2020. Retrieved March 4, 2020.
- "N.C. Board of Elections Approves 2020 Presidential Primary Ballots". Spectrum News. December 20, 2019. Retrieved December 22, 2019.
- "PRESIDENTIAL PREFERENCE - GRE (VOTE FOR 1)". er.ncsbe.gov. Retrieved March 4, 2020.
- "PRESIDENTIAL PREFERENCE - CST (VOTE FOR 1)". er.ncsbe.gov. Retrieved March 4, 2020.
- "2020 Election Forecast". fivethirtyeight.com. Retrieved October 22, 2020.
- "2020 Electoral Maps from Princeton Election Consortium". 270 to Win. Retrieved September 24, 2020.
- "2020 POTUS Race ratings" (PDF). The Cook Political Report. Retrieved May 21, 2019.
- "POTUS Ratings | Inside Elections". insideelections.com. Retrieved October 28, 2020.
- "Larry J. Sabato's Crystal Ball » 2020 President". crystalball.centerforpolitics.org. Retrieved November 2, 2020.
- "2020 Election Forecast". Politico. November 19, 2019.
- "Battle for White House". RCP. April 19, 2019.
- 2020 Bitecofer Model Electoral College Predictions, Niskanen Center, March 24, 2020, retrieved: April 19, 2020
- David Chalian; Terence Burlij. "Road to 270: CNN's debut Electoral College map for 2020". CNN. Retrieved June 16, 2020.
- "Forecasting the US elections". The Economist. Retrieved July 7, 2020.
- "2020 Election Battleground Tracker". CBS News. July 12, 2020. Retrieved July 13, 2020.
- "2020 Presidential Election Interactive Map". 270 to Win.
- "ABC News Race Ratings". CBS News. July 24, 2020. Retrieved July 24, 2020.
- "2020 Electoral Map Ratings: Trump Slides, Biden Advantage Expands Over 270 Votes". NPR.org. Retrieved August 3, 2020.
- "Biden dominates the electoral map, but here's how the race could tighten". NBC News. Retrieved August 6, 2020.
- "November 03, 2020 General Election Results by Contest" (PDF). North Carolina State Board of Elections.
Further reading
- David Weigel; Lauren Tierney (August 23, 2020), "The six political states of North Carolina", Washingtonpost.com, archived from the original on September 4, 2020
- Summary: State Laws on Presidential Electors (PDF), Washington DC: National Association of Secretaries of State, August 2020,
North Carolina
- David Wasserman (October 6, 2020), "The 10 Bellwether Counties That Show How Trump Is in Serious Trouble", Nytimes.com. (Describes bellwether New Hanover County, North Carolina)
External links
- "League of Women Voters of North Carolina". (State affiliate of the U.S. League of Women Voters)
- Government Documents Round Table of the American Library Association, "North Carolina", Voting & Elections Toolkits
- "North Carolina: Election Tools, Deadlines, Dates, Rules, and Links", Vote.org, Oakland, CA
- North Carolina at Ballotpedia